The consumer decision process - What can we learn from how we spend our money today?
We begin our look at the consumer decision process by looking at some readily available statistics from the Consumer Expenditure Survey. (The current data is from 2012, but it hasn't changed significantly from 2009 when we first did this analysis.) We can use this data to get a big picture, or aggregate, view of the kind of consumer choices we make as a population in the United States. For our friends outside the U.S., we are hopeful that you will be able to infer similar conclusions using data from your country, and we welcome any suggestions for data sources that can help us generate a more global view.
The Consumer Expenditure Survey provides a breakdown of spending for about 124 million consumer units (each with 2.5 persons on average). The Bureau of Labor Statistics (BLS) provides multiple views on this data with breakdowns by age, composition, education, occupation, etc. We will bypass the breakdowns for now to see what conclusions we might draw on the consumer decision process as a whole.
Consumer Expenditures using a Pareto Chart
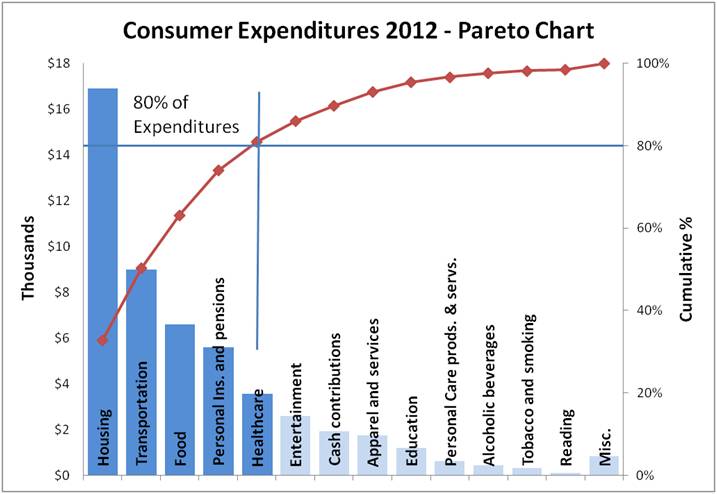
Using another problem solving and decision making tool, the Pareto chart, we can see the major consumer spending areas using the data from the Consumer Expenditure Survey. Pareto analysis (where 80% of the value comes from 20% of the spending choices) is often used in prioritizing problem solving activities, but in our case we can use it to help identify high value consumer decisions (on average), to the extent that past spending reflects what we value.
Using the chart we can gain some insight on the consumer decision process from observations for an average consumer:

- About one third of spending (32.8%) goes to housing and housing related items.
- 80.9% of all consumer spending is covered with decisions in five consumer areas: housing, transportation, food, personal insurance and pensions (protection of future income), and healthcare. Recognize that this is personal spending, and does not include government spending in these areas (for example: Social Security, Medicare).
- The top 7 consumer expenditure areas seem to correlate to normal need related items such as housing, transportation, food, health, clothing, with two exceptions. The insurance/pension item points to a need/desire to protect and prepare for the future (11.4% of expenditures), and entertainment (5.3% of spending), the need/desire for leisure or diversion
- The BLS expenditure categories may reflect some influence of personal core values. Exposing cash contributions, alcoholic beverages, and tobacco products as specific major categories makes it easier to see how spending is changing in these areas over time, although a more detailed look is needed to draw conclusions.
Have you noticed anything missing from this list? One of the consumer decisions I contend with every two years is a choice of cell phone, and the connected decision of cellular service provider (due to contract subsidy). At this level it is hard to see where those expenditures are captured. Time to take a look one layer down.
Exposing the next layer of consumer decision making
Drilling down one layer for housing expenditures from the Consumer Expenditure Survey reveals spending that can provide additional insight into the consumer decision process. Here are the spending items that are included under housing:
- Shelter - Mortgage, rent, property taxes, maintenance, other lodging
- Utilities - Natural gas, electricity, fuel oil and other fuels, telephone services, water and other public services
- Household operations - Personal services (such as a cleaning service), other household expenses
 Housekeeping supplies - Laundry and cleaning, postage and stationary, other household products
- Household furnishings and equipment - Household textiles, furniture, floor coverings, major appliances, small appliances, miscellaneous housewares and household equipment
Looking at the list, one might wonder why a number of these items are included as part of expenditures on housing. Start thinking in terms of Connected Decisions, and it starts becoming evident that many of these expenditures are either direct consequences of a housing decision, or a related decision that may be constrained or impacted by the housing choice. We can start to envision the decision network (see our decision making model) associated with a choice of housing.
Learning from our consumer decision survey
 By digging deeper into the Consumer Expenditure Survey, we have identified a set of high value consumer decisions that could benefit from our decision making approach. The survey at the bottom of our consumer decision making page was added to test which of these major consumer decisions are creating the most frustration for our visitors.
In this age of information overload and overwhelming choice, our plan is to sort through the noise and provide solutions that will add clarity to the consumer decision process. Your input will guide us toward providing clarity for the consumer decisions most important to you!
Return from Consumer Decision Process to Consumer Decision Making
- Decision Innovation
- info@decisioninnovation.com
Follow Us
![]()
![]()
![]()
![]()