The decision making tree - A simple way to visualize a decision
The decision making tree is one of the better known decision making techniques, probably due to its inherent ease in visually communicating a choice, or set of choices, along with their associated uncertainties and outcomes. Their simple structure enables use in a broad range of applications. They can be drawn by hand to help quickly outline and communicate the critical elements in a decision. Alternatively, a decision tree's simple logical structure enables it to be used to address complex multiple decision scenarios and problems with the aid of computers.
The basics of the decision making tree
Using a simple decision tree example, we can see the basic elements used when visualizing a choice. The drawing will generally have the following elements:
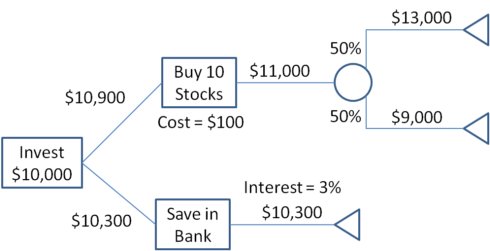
- Rectangles represent the decision or choice.
- Circles correspond to uncertain outcomes, with each following branch describing an outcome with a specified probability.
- Triangles signify the end of a path through the decision tree.
As seen in the above example the tree will model decision options with their consequences, including uncertain outcomes. In this example, the outcome of investing in ten different stocks has an equal chance of returning $13,000 or $9,000, leading to an expected (or average) return of $11,000. Three decisions are shown, starting with the choice to invest $10,000. A tree will also show all possible outcomes as exemplified by the investment returns of $13,000, $9,000, and $10,300.
To use the tree, a common measure of utility is used that enables determination of the path through the tree. As in this example, often utility is measured in dollars, making it easier to evaluate the impact of costs associated with some of the choices (e.g. the stock purchase cost).
The decision making tree is usually built starting with the initial decision option, and moving through choices and chance events until all outcomes are reached. Once the tree is developed, you work backward from the outcomes to determine the values used to find the best path or set of choices to move through the tree. In this case the expected return for the stock purchase of $10,900 makes it the best choice for the $10,000 investment (although with greater risk).
Applications for decision tree analysis

Decision trees have a natural "if ... then ... else ..." construction that makes it fit easily into a programmatic structure. They also are well suited to categorization problems where attributes or features are systematically checked to determine a final category. For example, a decision tree could be used effectively to determine the species of an animal.
As a result, the decision making tree is one of the more popular classification algorithms being used in Data Mining and Machine Learning. Example applications include:
- Evaluation of brand expansion opportunities for a business using historical sales data
- Determination of likely buyers of a product using demographic data to enable targeting of limited advertisement budget
- Prediction of likelihood of default for applicant borrowers using predictive models generated from historical data
- Help with prioritization of emergency room patient treatment using a predictive model based on factors such as age, blood pressure, gender, location and severity of pain, and other measurements
Because of their simplicity, tree diagrams have been used in a broad range of industries and disciplines including civil planning, energy, financial, engineering, healthcare, pharmaceutical, education, law, and business.
Advantages and benefits of the decision making tree as a technique
One of most systematic tools for decision making theory and application, tree diagrams have been used for many complex multi-stage decision problems. They can help form an unbiased view of risk and opportunity associated with any choice. They are often used in decision analysis to help identify a strategy with the highest likelihood to achieve a goal.
Decision making trees are an effective technique because they provide the following benefits and advantages:
- Easy to use and understand - Trees are easy to create and visually simple to follow. A brief explanation is usually sufficient to gain understanding.
- Transparent - The diagrams for a decision clearly lay out the choices and consequences so that all alternatives can be challenged. Results are clearly explained from the model using simple math.
- Provides an evaluation framework - The value and likelihood of outcomes can be quantified directly on the tree chart.
- Robust - They easily accommodate new assumptions with probabilities when facts are not readily available.
- Enables valuation of information - Decision trees enable a calculation of the value of perfect information, or the value of knowing what will happen in the future. This can help determine how much to spend on additional research to improve assumptions.
- Easily combined with other techniques - Other decision making techniques can be used to evaluate specific options through the tree. Net Present Value (NPV) and Project Evaluation Review Technique (PERT) analysis are common examples.
- Well suited for computers - The logical "if ... then ... else ..." structure and easy computation of a decision tree has made it a good target for use in computer decision tools and simulations.
What are some of the problems and limitations?
The systematic and logical structure of the decision making tree still requires the decision maker to scrutinize and validate the attributes that are being used to build the diagram. As in all logical structures, if the assumptions are false, conclusions will be misleading. The tree builder (decision maker) must ensure the distinction between causality and correlation, particularly for trees that will be used for predicting future outcomes.
Additional items to consider when choosing to use a decision tree include:

- Tree diagrams continue to grow as you move from the beginning node to final outcomes. This will limit tree size for those drawn manually.
- As tree size increases you can begin to lose transparency as it becomes more difficult to fully understand all the attributes and relationships embedded in the diagram.
- The goals and/or success factors are distributed across the tree structure making is possible to lose track of what is most important.
- Evaluation of the path through the tree may require use of a common metric for utility, typically monetary units. This may be difficult to achieve, particularly for intangibles such as core values.
- Decision trees are better matched to attributes with a finite set of fixed possibilities.
An excellent decision tree example
Here is a great example of a decision making tree that extracts and models knowledge gained by experts over a long period of time. The Vroom-Yetton-Jago Decision Model provides an alternative approach for choosing your style for collaborative decision making. This decision making tree packs years of experience into a single page that can be navigated with 8 questions that require only yes/no or high/low answers.
Related decision making techniques
A closely related analysis method is the influence diagram that is also a highly visual decision support tool. Influence diagrams focus on relationships between decision events and can provide a way to compact the information presented in a decision tree.
NPV analysis is often developed and visualized using a decision making tree. The tree diagram helps reveal where key risks are being added to the project being evaluated.
On the internet, a number of resources are available that support decision tree analysis, and often these tools will support influence diagrams, NPV analysis, and other related methods.

Return from Decision Making Tree to Decision Making Techniques
- Decision Innovation
- info@decisioninnovation.com
Follow Us
![]()
![]()
![]()
![]()